Foxglove Visualization
They reflect the Meadowlark (Carbon dev kit) API and may not apply to Carbon systems.
Fully updated documentation will be published when Carbon Alpha ships in April 2026.
Questions? Reach out to us at: support@voyantphotonics.com
Note: For the primary point cloud visualization, see the Voyant Visualizer guide. Foxglove remains the recommended path for ROS users.
This guide explains how to configure and visualize point cloud data using Foxglove Studio.
Introduction
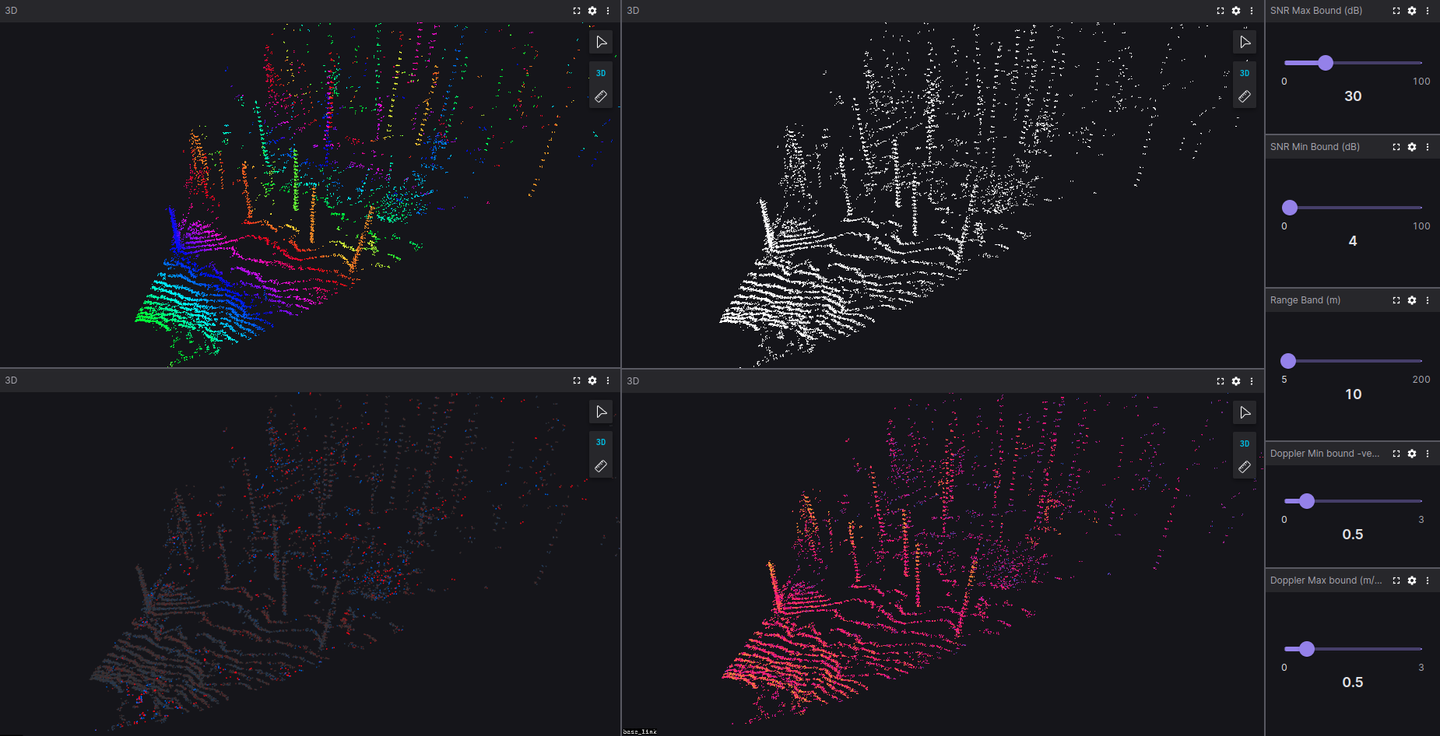
Visualizing point clouds with different colormaps enables better understanding of the data. Foxglove is a powerful tool that allows visualization of point clouds using various colormaps. In the image above, different colormaps are applied to the same point cloud within the Foxglove tool.
You can use Foxglove for visualizing Voyant point cloud data with either:
Using Foxglove Studio
See Quickstart Guide or Voyant ROS driver if you are not yet set up to properly run one of these tools.
Once you have installed the Voyant API or Voyant ROS driver and have one of the tools that stream data to foxglove for visualization running, you can:
-
Open Foxglove Studio in your browser at https://studio.foxglove.dev/ or launch the desktop application if installed.
-
Select
Open connection...in the upper left section of the window to bring up the connection dialog -
In the connection dialog, select “WebSocket” as the connection type.
-
Enter the WebSocket URL:
ws://localhost:8765and click “Connect”. -
In the layout selector, choose a compatible layout or create a new one with a 3D panel.
-
In the 3D panel settings, add the
/point_cloudtopic to visualize the point cloud data.
You should now see the point cloud visualization of the data you are sending to foxglove.
Importing Configuration Files
Configuration files differ between Voyant ROS and Voyant API:
- For Voyant ROS and Voyant SDK, the config files are located in the
configfolder.
To import the configuration:
- In the top right corner of the Foxglove GUI title bar, click the
Layoutbutton and import the desired configuration file from your local path.
Alternatively, follow the Foxglove Layout Guide to import the configuration file.
Playing Recorded Data
Foxglove Studio supports playback of recorded data in formats such as .bag, .db3, and .mcap, which are commonly used in the robotics community. .bin files recorded using the Recording a Data Session can be viewed through:
- Using the
voyant_playback_foxglovetool - Converting to
.mcapformat using the conversion tool in Voyant ROS and replayed directly in Foxglove
Point Cloud Visualizations
The point cloud visualizations include:
- Range-colored point cloud (HSV colormap, Top-left)
- Doppler-colored point cloud (Custom Red-Blue colormap, Bottom-left)
- SNR-colored point cloud (Custom colormap, Bottom-right)
- Raw point cloud (Top-right)
Range-colored Point Cloud
This visualization is colored based on the range of the point cloud data and follows a cyclic HSV colormap. The range value for the colormap is controlled via the Range Band (m) slider on the right side of the GUI.
Doppler-colored Point Cloud
This visualization is colored based on the Doppler values of the point cloud data and follows a custom Red-Blue colormap. Red represents positive Doppler values (moving away) and blue represents negative Doppler values (coming towards). The Doppler value range for the colormap is controlled via the Doppler min Bound (m/s) and Doppler max Bound (m/s) sliders on the right side of the GUI.
SNR-colored Point Cloud
This visualization is colored based on the SNR (Signal-to-Noise Ratio) of the point cloud data and follows a custom colormap. The SNR value range for the colormap is controlled via the SNR min Bound (dB) and SNR max Bound (dB) sliders on the right side of the GUI.
Control Features
Sliders
Variable Sliders on the right side of the interface allow control of the minimum and maximum bounds of the colormaps:
Range Band (m)controls the range of the HSV colormap for the range-colored point cloudDoppler min Bound (m/s)andDoppler max Bound (m/s)control the bounds of the custom Red-Blue colormap for the Doppler-colored point cloud (values outside this range are colored gray)SNR min Bound (dB)andSNR max Bound (dB)control the bounds for the SNR-colored point cloud
User Scripts
This visualization is implemented using Foxglove’s User Scripts feature, which allows custom scripts to manipulate point cloud data. The user scripts that color the point clouds can be found in the Voyant ROS repository under the config/foxglove_user_scripts folder. The Doppler and SNR colored point cloud implementations share a similar algorithm, differing only in the RGB values for Low, Mid, and High points of the colormap:
// Doppler colors (RGB)
Low: [255.0, 0.0, 0.0]
Mid: [49.0, 49.0, 49.0] (gray background)
High: [0.0, 100.0, 255.0]

// SNR colors
Low: [7.0, 107.0, 236.0]
Mid: [255.0, 0.0, 127.0]
High: [255.0, 204.0, 0.0]